Problem description & analysis:
In the Excel table below, column A contains categories and there are 2N key-value formatted columns after it:
A | B | C | D | E | F | G | |
1 | Country | Label1 | Count1 | Label2 | Count2 | Label3 | Count3 |
2 | US | A | 10 | B | 9 | C | 8 |
3 | US | D | 9 | C | 8 | A | 7 |
4 | US | C | 8 | D | 7 | B | 6 |
5 | US | A | 7 | C | 6 | B | 5 |
6 | CA | A | 10 | B | 9 | C | 8 |
7 | CA | D | 9 | C | 8 | A | 7 |
8 | CA | C | 8 | D | 7 | B | 6 |
9 | IN | A | 10 | C | 9 | B | 8 |
10 | IN | D | 9 | A | 8 | B | 7 |
11 | IN | A | 8 | D | 7 | B | 6 |
We need to group rows by the category and the key and perform sum on detail data. The expected result set will have 3 columns. Note that the result set should be arranged according to the original order of the category column.
A | B | ||
1 | Country | Label | Total |
2 | US | A | 24 |
3 | US | B | 20 |
4 | US | C | 30 |
5 | US | D | 16 |
6 | CA | A | 17 |
7 | CA | B | 15 |
8 | CA | C | 24 |
9 | CA | D | 16 |
10 | IN | A | 26 |
11 | IN | C | 9 |
12 | IN | B | 21 |
Solution:
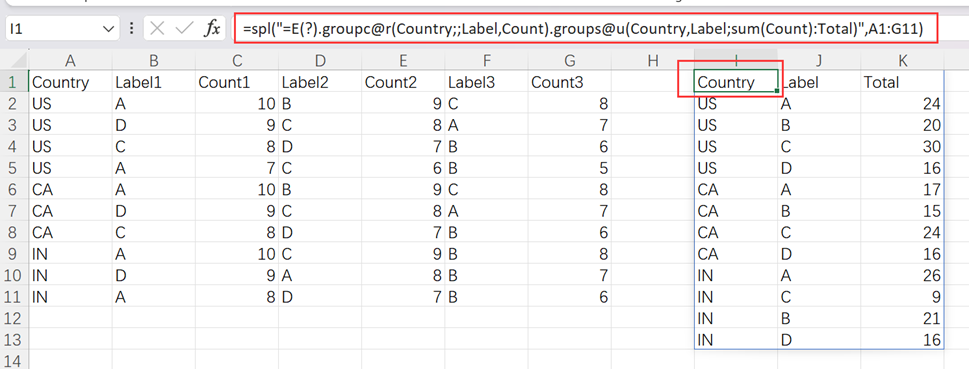
Use SPL XLL to enter the following formula and drag it down:
=spl("=E(?).groupc@r(Country;;Label,Count).groups@u(Country,Label;sum(Count):Total)",A1:G11)

Solution:
E()function reads data in its original table format. groupc@r performs column-to-row transposition by putting every n column in one group. groups() function performs grouping & aggregation.
For more references:
SPL download address: esProc Desktop Download
Plugin Installation Method: SPL XLL Installation and Configuration
References to other rich Excel operation cases: Desktop and Excel Data Processing Cases
SPL Programming (YouTube FREE courses): https://www.youtube.com/playlist?list=PLQeR-IhHo7qNCw6o7PW8YfHvRx8pgzZso
